Displayr AI
Transforms confusing variable names into clear labels to streamline data analysis and reporting.
Are you the owner?
Claim this tool to publish updates, news and respond to users.
Sign in to claim ownership
Sign InDescription
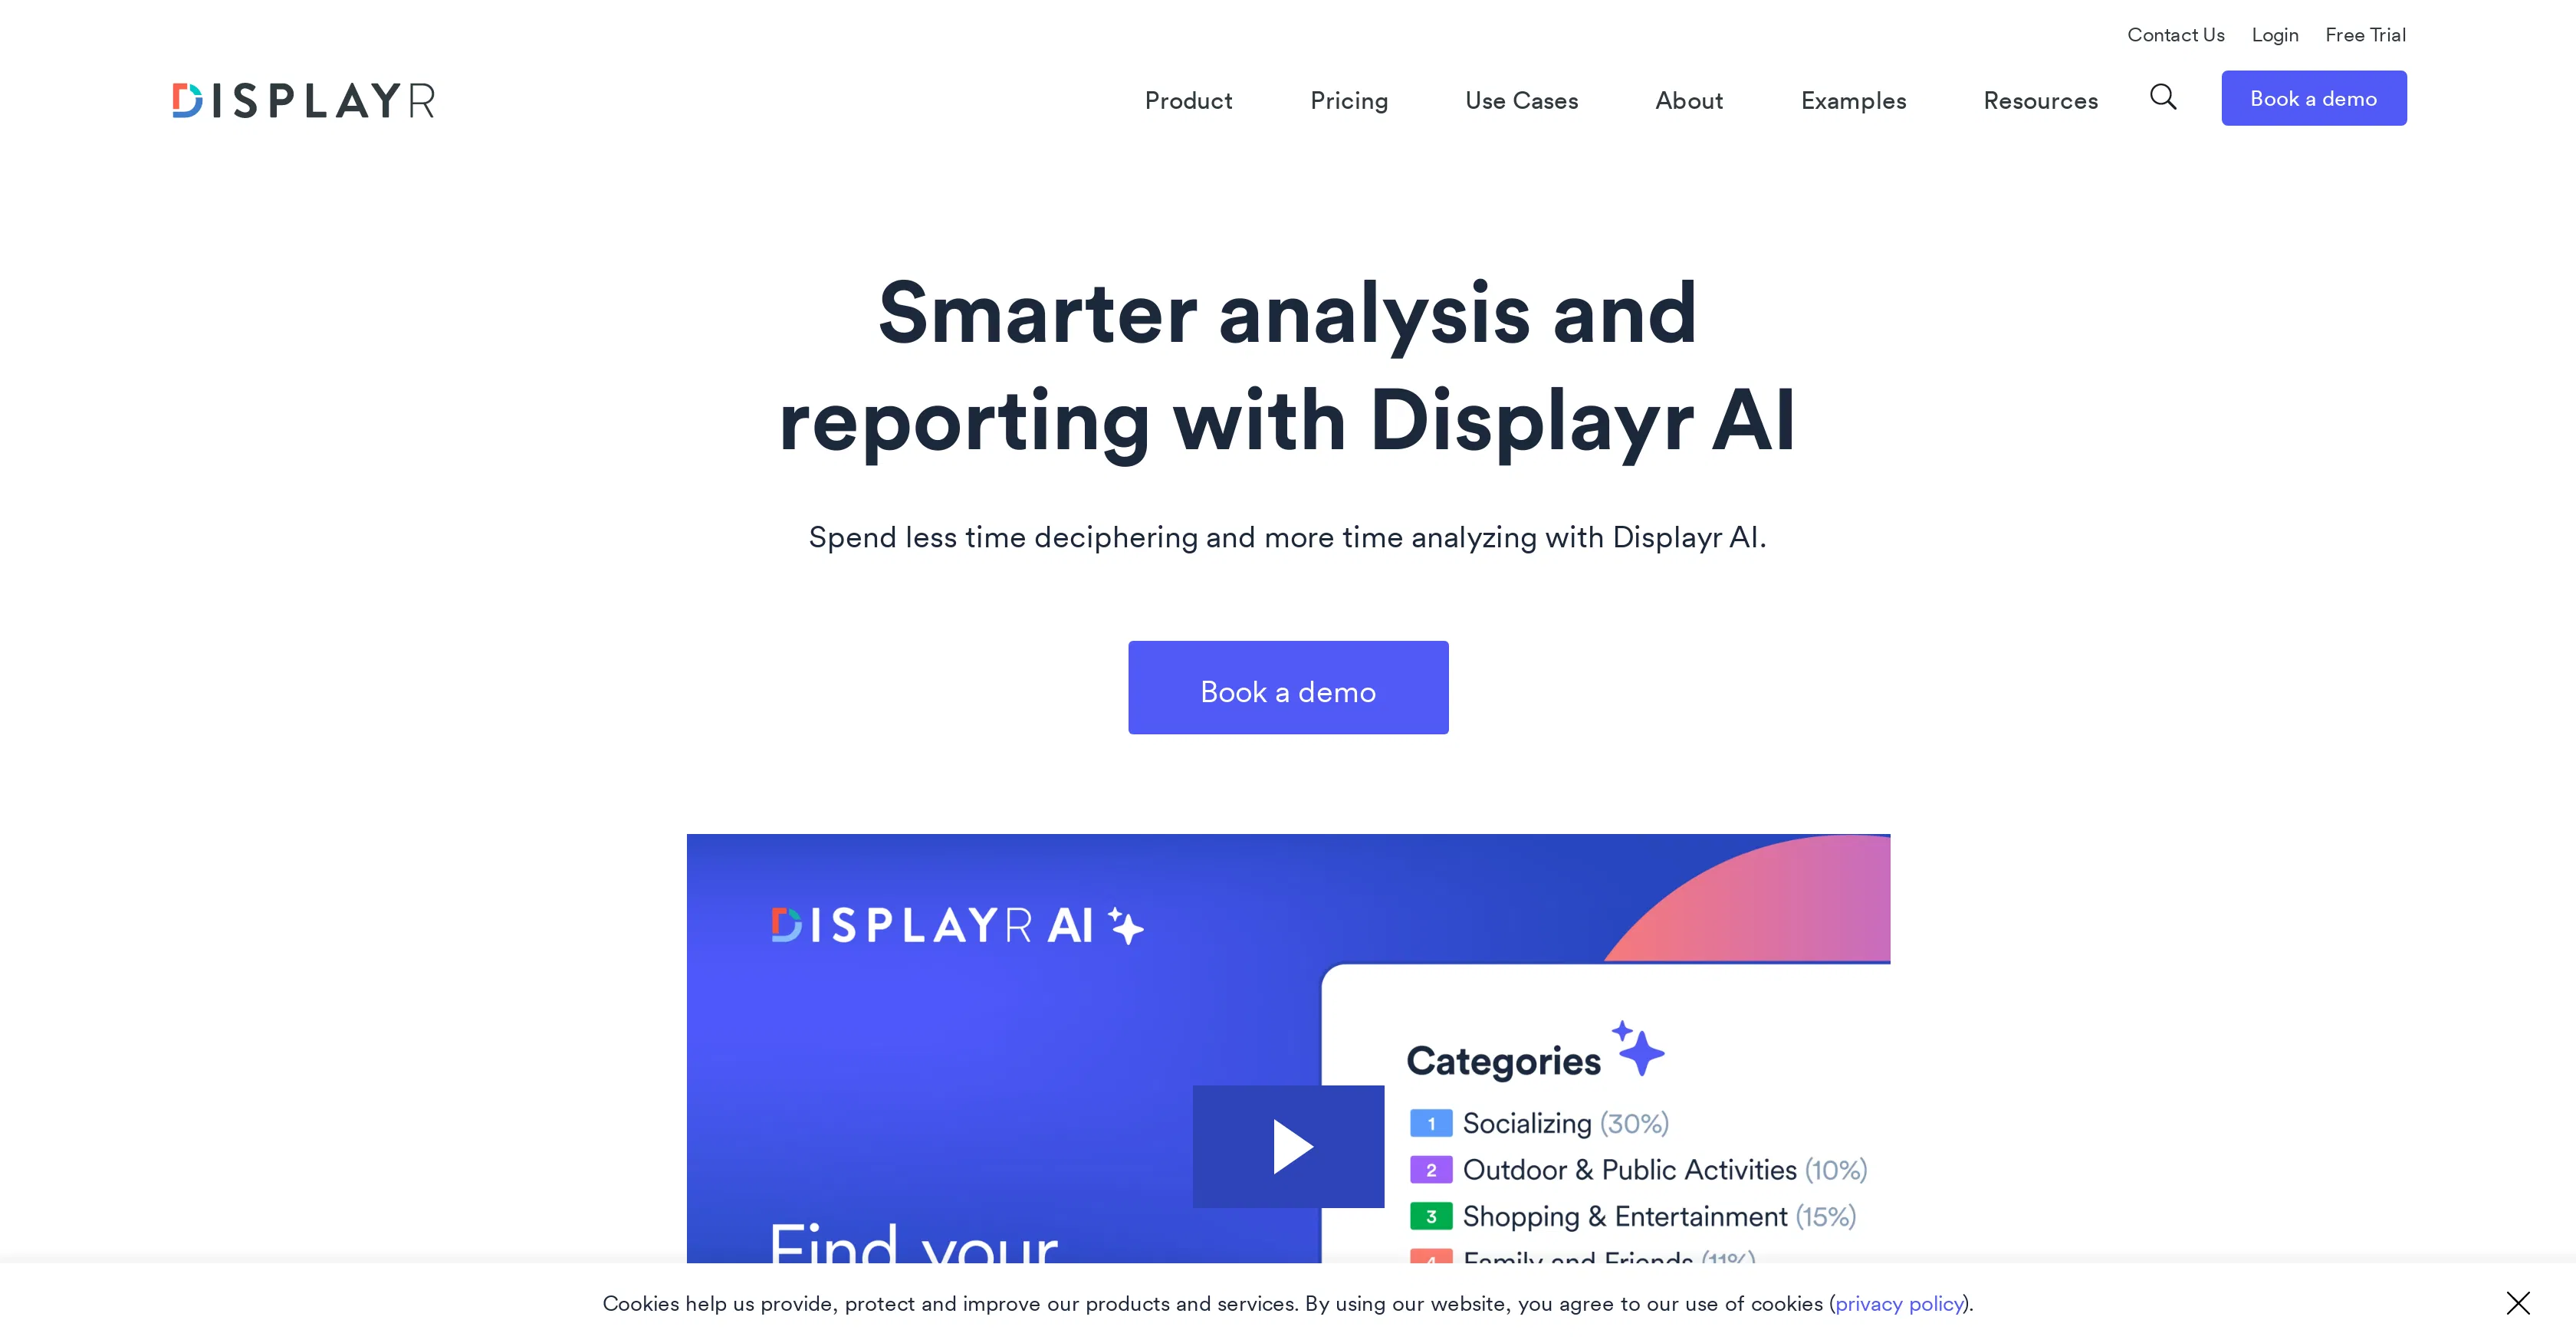
Displayr AI is a specialized tool developed by the team at Displayr, designed to automate and enhance the efficiency of data analysis workflows. Its core value lies in reducing the manual, time-consuming tasks associated with data cleaning and preparation, allowing analysts and researchers to focus on deriving insights and creating compelling reports. By leveraging artificial intelligence, it tackles one of the most common and tedious bottlenecks in the analytical process.
Key features include the intelligent renaming of lengthy and obscure variable names into concise, meaningful labels that are instantly understandable. It automates the generation of detailed reports and dashboards from raw data, supports advanced statistical testing and modeling, and provides tools for creating interactive visualizations. The platform also facilitates collaboration by allowing teams to work on the same project simultaneously with version control and commenting features.
What sets Displayr AI apart is its deep integration of AI specifically for data semantics and context understanding, going beyond simple automation to interpret the intended meaning behind data columns. It is a cloud-based platform accessible via a web browser, eliminating the need for local software installation. It integrates seamlessly with common data sources like spreadsheets, SQL databases, and survey platforms (e.g., Qualtrics, SurveyMonkey), and can export results to PowerPoint, PDF, or embeddable HTML.
Ideal for market researchers, data scientists, business analysts, and academic researchers who regularly work with large, messy datasets from surveys or operational systems. Specific use cases include automating the report generation for recurring client deliverables, cleaning and standardizing data from multiple international surveys for comparative analysis, and enabling non-technical stakeholders to explore data through interactive dashboards without writing code.